A History of ECGs
- V. A. Cyr
- Oct 9, 2024
- 9 min read

As we began discussing diagnosing tools in A History of Bloodwork Part I and Part II, we will now look into another popular diagnostic tool: the ECG. ECGs were briefly discussed in the post on Heart Rate & Pulse Oximetry, and now we will look into their origins and how it is used today in medicine. What does an ECG tracing look like, and how is it calculated? What does it mean to have a heart arrhythmia? What is the difference between ECG and EKG?
Definitions
Electrocardiogram
ECG stands for electrocardiogram, coming from the words “electric” (electro), “heart” (cardio), and “recording” (gram). This machine does electrocardiography or graphs the cardiac cycle (heartbeat). An EKC is the same as an ECG but is from the German spelling (elektrokardiogramm). You will often hear people use both abbreviations interchangeably. These tools can be integrated into cardiac monitors, defibrillators, and vital sign machines.

Here is an example of an ECG machine placed on a patient (Mount Sinai, 2024).
ECG Electrodes & Leads
Electrodes
Electrodes are small metal pieces placed on the body to conduct the electricity from the heart. The electricity felt in the electrodes is processed by the computer in the monitor and emitted into a tracing showing all parts of the cardiac cycle. There are different ways these electrodes can be placed on the body, depending on the complexity of the reading needed. The different electrodes are labelled depending on their location on the body and coloured coded. RA is for the right arm and is white, LA is for the left arm and is black, LL is for the left leg and is red, and RL is for the right leg and is green. A familiar phrase nurses use to remember which electrodes go above and below the heart is: “clouds over grass, smoke over fire,” meaning white over green and black over red (see the 5-lead ECG diagram). The electrodes are placed around the heart in a specific manner to receive the electrical information passing through the heart. As seen in the diagram below, the electricity passing from RA to LA gives the tracing of lead I, RA to LL gives lead II, and LA to LL gives lead III. These leads are further explained below.
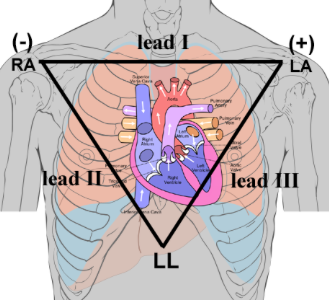
An example of how electricity is picked up through the heart in an ECG (Vanderbilt University, 2024). This is called Einthoven’s triangle (see below).
3-Lead ECG
In a 3-lead ECG, there are three electrodes put on the body: one on the right side of the chest (RA, white), one on the left side of the sternum above the heart (LA, black), and one on the left side of the body below the heart (LL, red).
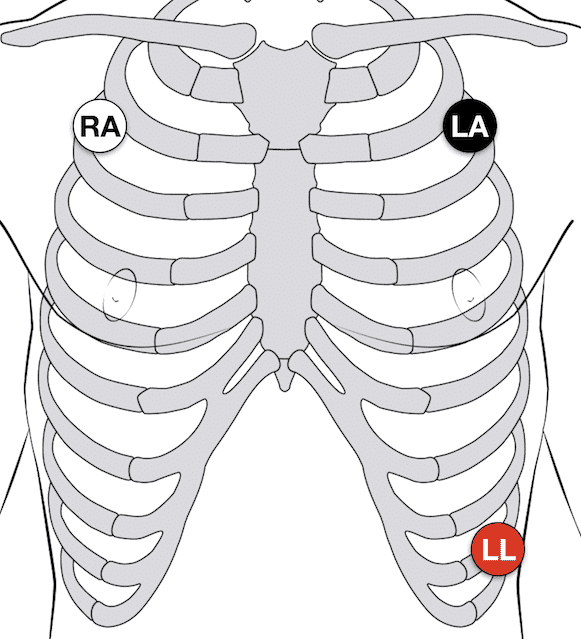
Placement of the five electrodes in a 3-lead ECG (Cadogan, 2022).
5-Lead ECG
In a 5-lead ECG, five electrodes are put onto the chest. Like a 3-lead ECG, the RA, LA, and LL electrodes go in the same location. However, the 5-lead adds the RL to the right side of the body, matching the LL, and one V electrode in the fourth intercostal space (between the ribs) on the right side of the sternum (chestbone). In both 3- and 5-lead ECGs, the yield will be three tracings on the monitor (leads I, II, and III). The V precordial electrode is added in a 5-lead ECG.

Placement of the five electrodes in a 5-lead ECG (Cadogan, 2022).
12-Lead ECG
A 12-lead ECG uses ten electrodes, six positioned around the heart (precordial electrodes) and four on the limbs (limb electrodes). The precordial electrodes are numbered V1 to V6. From right to left (on the patient), V1 is placed on the right side of the sternum in the fourth intercostal space. V2 is placed on the same intercostal space on the left side of the sternum. V3 is placed between V2 and V4 (around the 5th rib). V4 is placed on the left mid-clavicular line between ribs five and six. The mid-clavicular line is the imaginary line that goes down the chest, starting at the middle point of the clavicle (collarbone). V5 is placed horizontally from V4 under the left anterior axillary (armpit) line. V6 is also placed horizontally from V4 and V5 under the armpit in the mid-axillary line. The mid-axillary line is the imaginary vertical line that goes down the side of the body under the armpit. The limb electrodes are placed symmetrically on the right and left arm and right and left leg. These electrodes must not be on bony prominences (e.g., elbow, knee) and must avoid spaces with thick muscle (e.g., bicep, calf). In 12-lead ECGs, although there are only ten electrodes, the monitor will have twelve tracings (leads I, II, III, V1-6, aVR, aVL, and aVF). The aVR, aVL, and aVF limb leads stand for augmented (a) voltage (V) of the right arm (R), left arm (L), and foot (F).

Placement of the precordial leads (V1 to V6) in a 12-lead ECG (Häggström, 2012).
ECG Tracings
A 12-lead ECG has many lines printed out on graph paper. The graph paper is a specific size to calculate the time in each cardiac cycle phase. The cardiac cycle is expressed in a wave pattern including the P, Q, R, S, and T waves. You can review the heart’s anatomy in the Auscultation post and the physiology of the heart in the Heart Rate post.
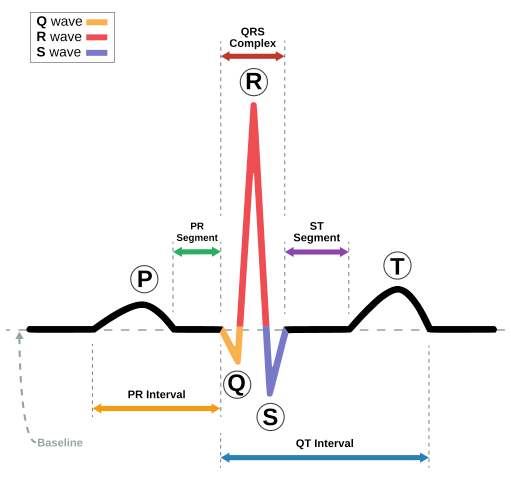
An ECG waveform of a heart in normal sinus rhythm (Atkielski, 2007).
The P wave starts the cardiac cycle with the right and left atrium depolarization. This is when the electrical signal begins in the SA node and travels to the AV node (atriums are filled with blood). The PR segment is the time between the P wave and the QRS complex. The PR interval is the time between the P wave and the R wave (red). The QRS segment has three parts: the Q wave (yellow), the R wave (red), and the S wave (blue). The Q wave signifies the electricity from the atria into the ventricles (blood going from the atrium into the ventricles). The R wave is the depolarization of the ventricles (pushing the blood out of the heart). The S wave is the final depolarization of the ventricles and when the electricity goes into the Purkinje fibres (when they begin to relax to be filled with blood again). The ST segment is the time between the end of the QRS and the T wave. The QT interval is the time between the Q wave and the T wave. The T wave represents ventricular repolarization (ventricles filling with blood). These waves and segments can be altered by disease and medications, which will be reviewed in the last section.
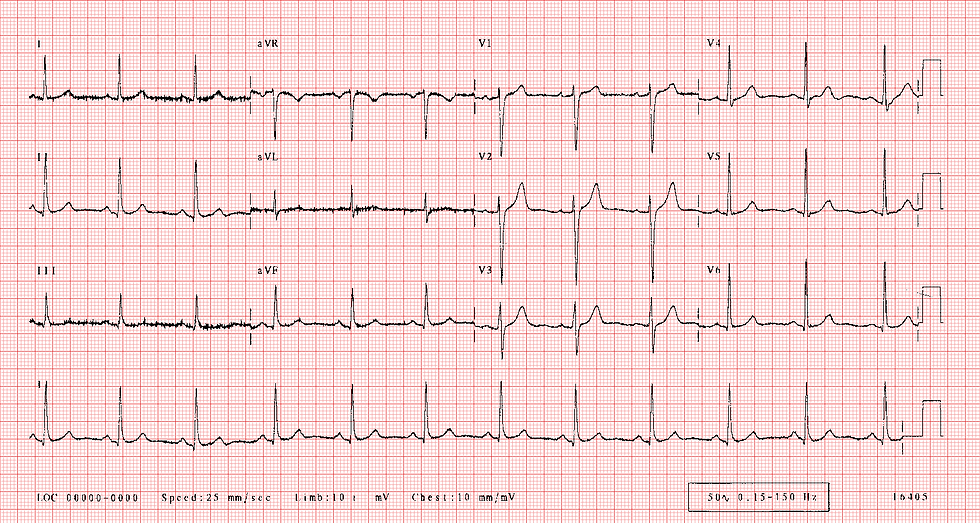
This is a 12-lead ECG tracing of normal sinus rhythm (Jenkins & Gerred, 2017).
Leads I, II, and III are seen on the left side in the first column. Leads aVR, aVL, and aVF are in the second column. V1 to V6 are in the third and fourth columns. The bottom line of the ECG is lead II. Lead II is most commonly used to measure heart rhythm as it measures the closest to the heart’s middle axis (from the SA node to the AV node).
Origins
In 1872, Alexander Muirhead attached wires to the wrist of a patient with a fever to obtain an electronic record of their pulse (Westhorpe & Ball, 2010). In 1887, Augustus Waller invented the capillary electrometer machine fixed to a projector, allowing them to record the pulse in real-time (Westhorpe & Ball, 2010). In 1895, Willem Einthoven assigned the letters P, Q, R, S and T to the waveforms of an ECG and founded leads I, II, and III (Westhorpe & Ball, 2010). 1897 saw the invention of the string galvanometer by Clément Ader (Westhorpe & Ball, 2010). This worked by placing the patient’s hands and feet in salt water to conduct the electricity to the machine.
In 1901, Einthoven used the string galvanometer as the first practical ECG (Westhorpe & Ball, 2010). This machine was much more sensitive than the capillary electrometer. In 1912, Einthoven reported on Einthoven’s triangle as a base for electrode placement for an ECG (Westhorpe & Ball, 2010). In 1927, General Electric made a machine that differed from the string galvanometer, consisting of amplifier tubes and a moving mirror that wrote the tracing onto paper (Westhorpe & Ball, 2010). Emmanuel Goldberger founded the 12-lead ECG in 1942 (Westhorpe & Ball, 2010). He augmented the limb leads (aVR, aVL, and aVF) and put all the limb leads with the precordial leads to create the 12-lead ECG still used today. In 1931, F. N. Wilson worked on Enthoven’s research and developed Wilson’s central terminal (WCT). WCT is a reference point in the middle of the thorax, giving a more precise location of the middle of Einthoven’s triangle (ECG & Echo Learning, n.d.). Wilson put the six precordial (V1-V6) electrodes around the heart to get the best reading.
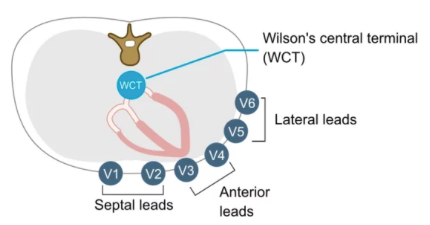
Here is a top view of the chest cavity with the precordial electrode placement relative to WCT (ECG & Echo Learning, n.d.).
Timeline Throughout History: ECG Machines

Uses in Medicine
Normal ECG Findings
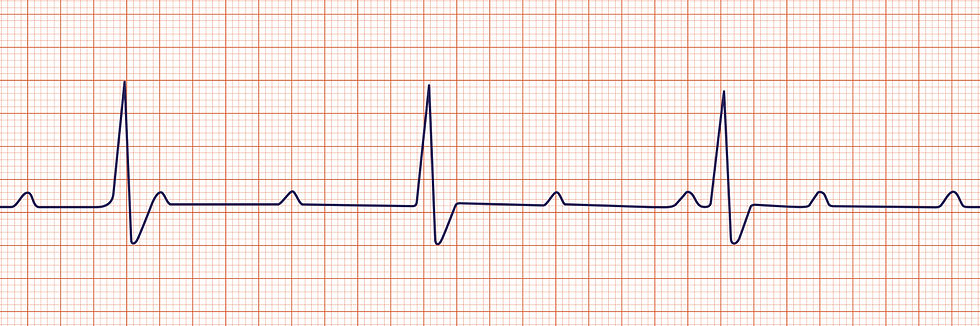
Normal sinus rhythm is when the heart beats between 60 to 100 beats per minute (bpm) and has a normal waveform for all parts of the ECG.
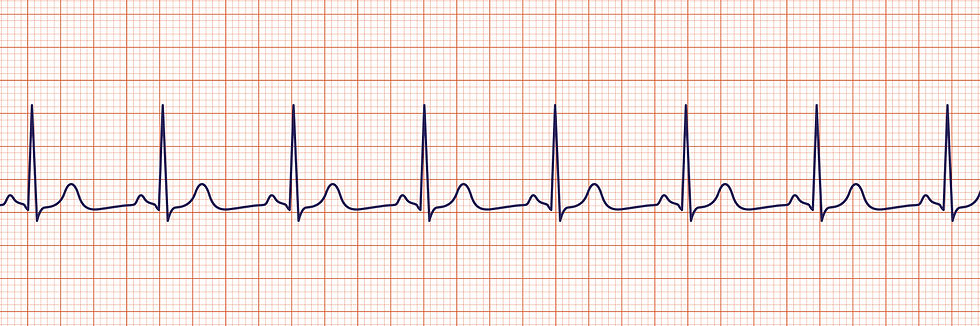
Sinus rhythm (ACLS Medical Training, 2024).
Abnormal ECG Findings
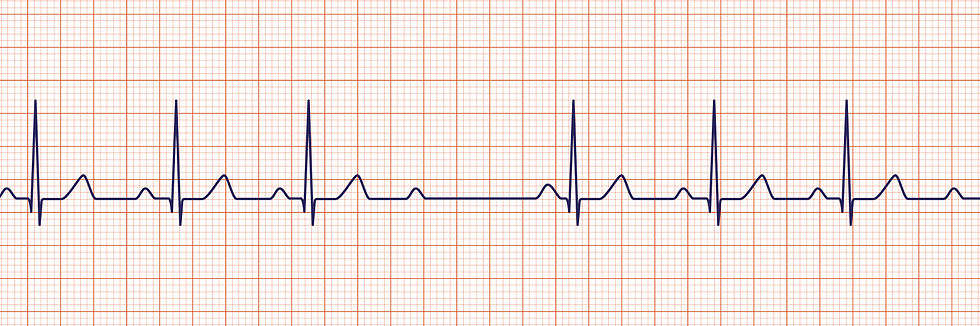
Sinus bradycardia is a normal heart rhythm with pulse beats slower than 60 bpm.

Sinus bradycardia (ACLS Medical Training, 2024).
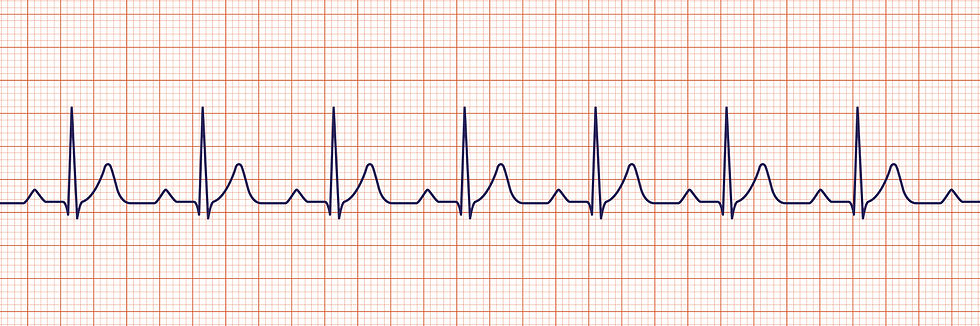
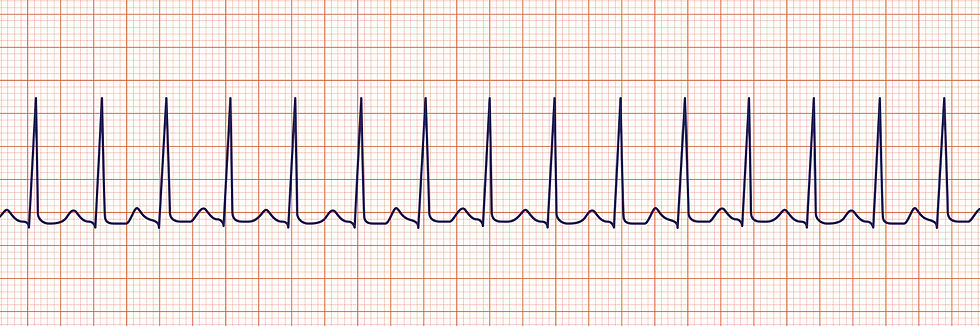
Sinus tachycardia is a normal heart rhythm, with a pulse beating faster than 100 bpm.

Sinus tachycardia (ACLS Medical Training, 2024).
Heart block can be caused by many conditions, such as disease (e.g., myocarditis), trauma (e.g., myocardial infarction or “heart attack”), medications (e.g., digoxin), and old age. There are three degrees of heart block, ranging from better (first) to worst (third).
First-degree heart block has a lengthening of the PR interval.
First-degree heart block (ACLS Medical Training, 2024).
Second-degree AV heart block has two different types.
Type I (Mobitz I or Wenckebach) has a progressive lengthening of the PR interval until a QRS complex is completely dropped (missed heartbeat).
Type II (Mobitz II) is characterized by a random drop in QRS complexes.
Second-degree heart block (ACLS Medical Training, 2024).
Third-degree heart block occurs when there is no relationship between the P wave and the QRS complex (the heart is not functioning properly).
Third-degree heart block (ACLS Medical Training, 2024).
Superventiruclar tachycardia (SVT) is a very fast rhythm where the QRS complexes are firing before they should be and a narrowed.
SVT (ACLS Medical Training, 2024).
Atrial fibrillation (AFib) is a common arrhythmia. It is characterized as an irregular heartbeat with no waves before the QRS complex. This is common in patients with hypertension, heart disease, and diabetes mellitus.

AFib (ACLS Medical Training, 2024).
Atrial flutter occurs where there are multiple P waves before a QRS. This gives the ECG a sawtooth look. The causes are similar to AFib, as someone with a history of cardiac problems can be at risk of developing this arrhythmia.
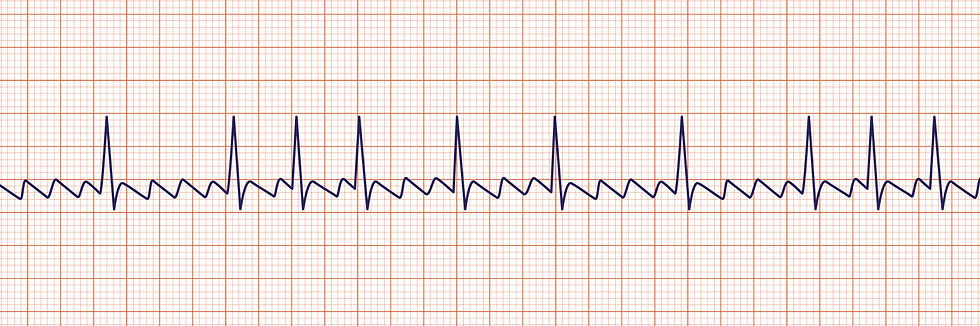
Atrial flutter (ACLS Medical Training, 2024).
Ventricular tachycardia (VTach) occurs when the QRS complex is widened, and the heartbeat beats over 100 bpm. This is an emergency and must be defibrillated to be corrected. VTach can occur due to a disease process or anything that can affect the electrical impulses in the heart.

VTach (ACLS Medical Training, 2024).
Ventricular fibrillation (VFib) is even more chaotic than VTach with no pattern or pulse. This rhythm is also an emergency that needs to be defibrillated. Similar to VTach, VFib is also caused by many problems like electrolyte imbalances, heart failure, and trauma.

VFib (ACLS Medical Training, 2024).
This overview of ECGs gives us a good idea of how far we have come in studying the heart in medicine. ECGs are not an easy topic to learn in school, and often it takes extra training to work on a telemetry unit in a hospital. I hope you learned something new while reading this post. What fascinates you most about the heart?
– V. A. Cyr
References
ACLS Medical Training. (2024). ACLS Rhythm Strips Training and Interpretation [Images]. https://www.aclsmedicaltraining.com/rhythm-recognition/
Arora, N. & Mishra, B. (2021). Alexander Muirhead ECG Research Instrument
[Image]. Research Gate. https://www.researchgate.net/figure/Alexander-Muirhead-ECG-Research-Instrument_fig2_351709332
Ashley, E. A. & Niebauer, J. (2004). Chapter 3: Conquering the ECG. In E. A. Ashley & J. Neibauer’s Cardiology Explained [eBook]. London: Remedica. https://www.ncbi.nlm.nih.gov/books/NBK2214/
Atkielski, A. (2007). Sinus Rhythm Labels [Image]. Wikimedia Commons. https://commons.wikimedia.org/wiki/File:SinusRhythmLabels.svg
Cadogan, M. (2022). ECG Lead positioning [Image]. Life in the Fast Lane. https://litfl.com/ecg-lead-positioning/
Chan, A. (2014). Figure. Sanborn Viso Cardiette Electrocardiograph Model 51, specially made for Dr HP Yew [Image]. Hong Kong Medical Journal, 20(172). https://www.hkmj.org/abstracts/v20n2/172.htm
ECG & Echo Learning. (n.d.). The ECG Leads: Electrodes, limb leads, chest (precordial) leads and the 12-Lead ECG. https://ecgwaves.com/topic/ekg-ecg-leads-electrodes-systems-limb-chest-precordial/
Häggström, M. (2012). Precordial leads in ECG (Image). Wikimedia Commons. https://commons.wikimedia.org/wiki/File:Precordial_leads_in_ECG.png
Hospital Store. (2023). ECG Machine Price Range [Image]. https://www.hospitalstore.com/price-check-a-comprehensive-guide-to-ecg-machine-costs/
Jenkins, D. & Gerred, S. (2017). Normal ECG [Image]. ECG Library. https://ecglibrary.com/norm.php
Mount Sinai. (2024). Electrocardiogram [Image]. https://www.mountsinai.org/health-library/tests/electrocardiogram
N. A. (2008). Willem Einthoven ECG [Image]. Wikimedia Commons. https://commons.wikimedia.org/wiki/File:Willem_Einthoven_ECG.jpg
N. A. (2023). Fig. 3 Finished string galvanometer [Image]. ETHW.
https://ethw.org/Milestones:Strring_Galvanometer,_1901-1905
Salam, A. M. (2019). The capillary electrometer [Image]. Research Gate. https://www.researchgate.net/figure/The-capillary-electrometer_fig1_337279765
Vanderbilt University. (2024). Fig. 5 Einthoven's Triangle of ECG electrode placement [Image]. https://researchguides.library.vanderbilt.edu/c.php?g=156859&p=1125029
Westhorpe, R. N. & Ball, C. (2010). The electrocardiogram. Anaesthesia and Intensive Care, 28(2). https://journals.sagepub.com/doi/pdf/10.1177/0310057X1003800201
Comments